Discover the Top 8 most effective MT4 and MT5 indicators to enhance your forex trading. Learn about accurate and reliable indicators to make smart trading decisions and optimize profits
Classification of the most effective MT4 and MT5 indicators when trading forex
Currently, indicators in MT4 and MT5 are very popular and have diverse functions, however, there are 2 main types including: Leading indicators, and Lagging indicators. Specifically:
Leading indicators – oscillators
Leading indicators, also known as oscillators, are indicators that provide signals before there is a price fluctuation. Some popular leading indicators include RSI, CCI and Stochastic.
These indicators often oscillate within the limits of two values. For example, CCI oscillates between -100 and 100 (or -200 and 200, depending on market conditions), RSI and Stochastic oscillate between 0 and 100.
When the leading indicator approaches the upper limit, this indicates that the market is overbought. Conversely, when the leading indicator approaches the lower limit, this indicates that the market is oversold, meaning that the market is likely to rise.
Leading indicators are an important tool for traders, as they provide early signals of potential price reversals or trends. By understanding and using this indicator effectively, traders can make informed decisions and enhance their trading strategies.
Advantages of Leading indicators:
– Create early signals to help traders not miss opportunities.
– Helps bring profits to many traders if they know how to take advantage of the right trend.
Disadvantages of Leading indicators:
– Create many noise signals that are risky for inexperienced traders.
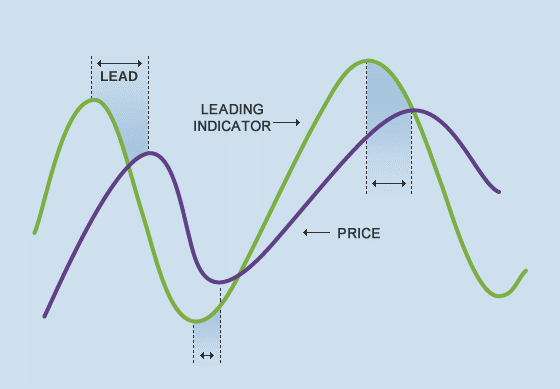
Indicator MT4 and MT5: Leading Indicator
Lagging indicators – momentum indicators
Momentum indicators, also known as lagging indicators, are formed based on historical price information, meaning they catch up with price fluctuations and then provide signals. This is why it is called a “lagging indicator”.
Some popular momentum indicators include MA, EMA, DEMA, Momentum and many others. Because their signals have a delay, this makes it difficult to find entry opportunities when the market is forming a top or bottom.
However, in a strongly trending market, momentum indicators become very useful because they help traders maintain positions in the overall trend and generate good profits. Momentum indicators are not suitable for sideways markets.
Advantages of Lagging indicators:
– Higher accuracy than Leading Indicators
Disadvantages of Lagging indicators
– Signals are often delayed, making it difficult for new traders to make profits.
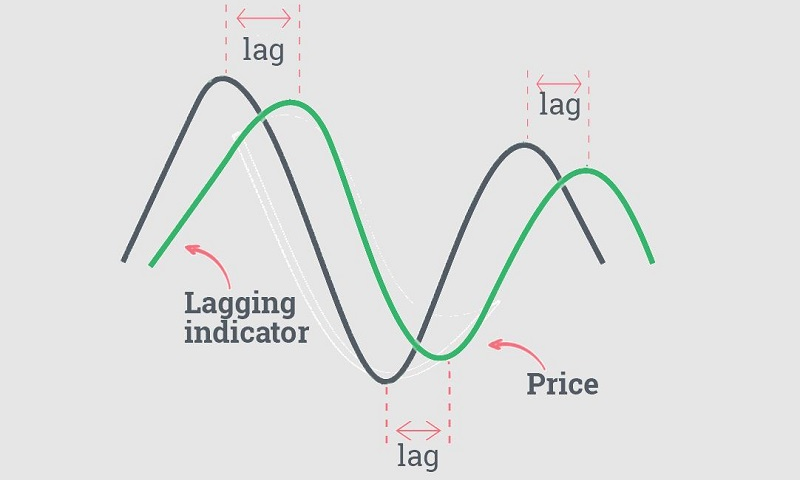
Lagging Indicator
Top of the popular, available and detailed usage indicators in MT4 and MT5
Technical indicators are one of the indispensables when trading forex. A trader using the Price Action method, even if only using price patterns, will certainly need the support of indicators at some point. Or even investors who follow the basic technical analysis school sometimes use indicators to determine market trends most accurately. Next, let’s learn about the available, free and importantly useful indicators in MT4 and MT5 when trading forex!
1. MACD Indicator (Moving Average Convergence Divergence)
The MACD line (Moving Average Convergence Divergence) is the moving average convergence divergence.
This indicator was born in 1979 by Gerald Appel. This is one of the most used indicators in technical analysis. It is considered one of the most popular and commonly used technical indicators in technical analysis.
MACD is calculated by taking the EMA12 moving average line minus the EMA26 line. In addition, there is an EMA9 line that acts as a signal line and helps provide buy and sell signals.
How to use the MACD indicator
- Buy signal: The MACD line crosses the signal line from the bottom up. The histogram turns green.
- Sell signal: The MACD line crosses the signal line from top to bottom and the histogram turns red.
To use the MACD indicator more effectively, you can combine it with other methods such as candlestick patterns, chart patterns, and Price Action.
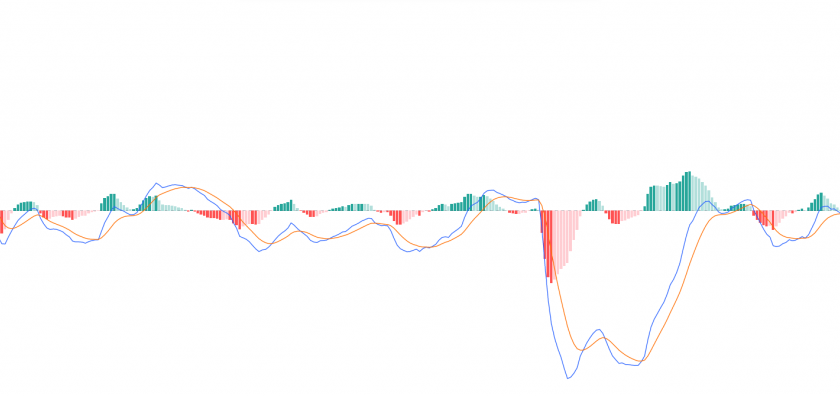
MACD indicator
2. RSI Indicator (Relative Strength Index Indicator)
RSI stands for Relative Strength Index, also known as the relative strength index. This indicator helps calculate the ratio between the average price increase and decrease over a certain period of time.
The RSI value is represented on a scale from 0 to 100.
How to use RSI
- If the RSI is greater than 70, it means that the asset is overbought, warning that the uptrend is likely to reverse.
- If the RSI is less than 30, it means that the asset is oversold, warning that the price may be near the bottom and preparing to reverse.
The area between 30 and 70 is considered a neutral zone, and when the RSI fluctuates around 50, the market is not trending.
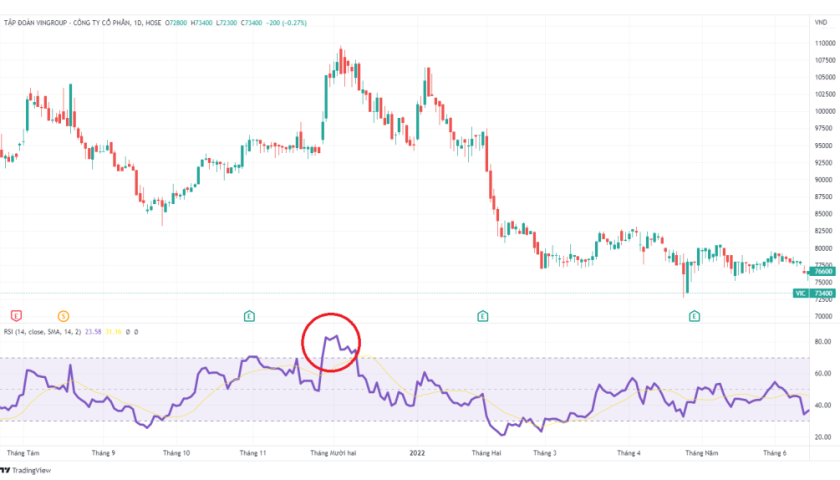
RSI indicator
3. Renko Chart (Renko Chart)
This is a different type of chart than the usual one. This chart uses bricks that replace traditional candlesticks. This is a very good noise filtering tool in trading.
Renko Chart only displays price fluctuations greater than a predetermined level. It helps identify important top and bottom reversal points.
This indicator works very well in the role of filtering noise and helping traders focus more on the main trend.
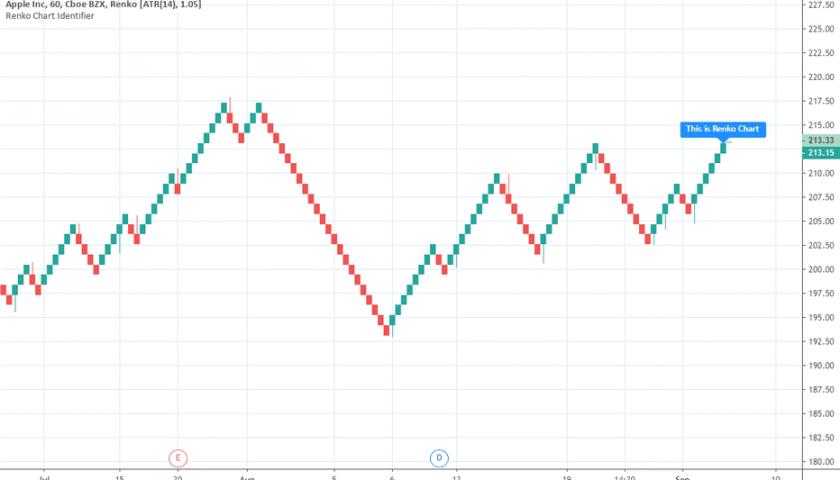
Renko Chart
4. Bollinger Bands
Bollinger Bands are a very popular tool in technical analysis, this is a tool to measure market volatility
Bollinger Bands are made up of 3 SMA lines including:
– Middle Band is SMA20
– Upper Band is calculated by taking the SMA line plus 2 times the standard deviation
– Lower Band is calculated by taking the SMA line minus 2 times the standard deviation
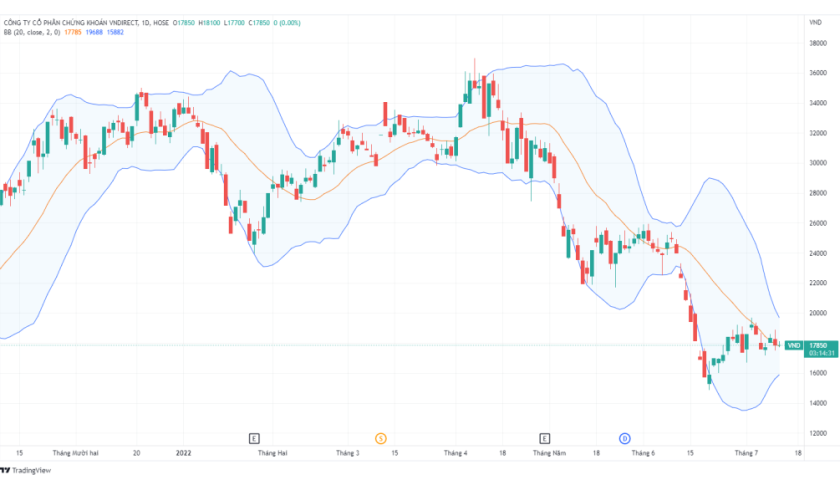
Bollinger Band Indicator
How to use Bollinger Bands?
Bollinger Bands can be used well when the market is sideways, traders can sell when the price hits the upper band and buy when the price hits the lower band.
However, when the market is clearly trending, this strategy is very risky.
5. Stochastic Indicator
Stochastic is an indicator that helps compare the closing price with a price range over a certain period of time, thereby showing the momentum of the price. This indicator is made up of 2 lines %K and %D and it helps traders find trend reversal points.
How to use Stochastic indicators?
This indicator has 2 boundary lines 20 and 80 to determine overbought and oversold thresholds.
If the indicator crosses the 80 boundary line, it shows that the asset is overbought. This also warns that the uptrend is likely to reverse.
If the indicator exceeds the 20 boundary line, it shows that the asset is oversold and is also a sign that the price may be near the bottom, preparing to turn up.
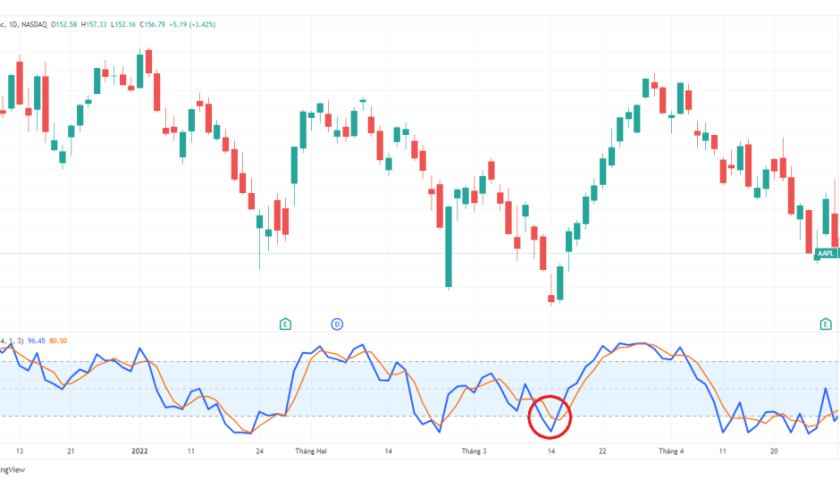
Stochastic Indicator
6. Ichimoku Cloud
Ichimoku Cloud, full name Ichimoku Kinko Hyo, is a technical analysis indicator developed by Satoru Hosoda in 1969
Ichimoku Cloud is an indicator used to identify dynamic resistance and support levels, determine momentum and provide trading signals.
This indicator is called the Ichimoku cloud because it is shaped like a cloud. It is built on moving average lines, helping to see trading information such as price trends, support and resistance levels, and entry and exit signals. The Ichimoku indicator set is made up of 5 moving average lines, including:
- Tenkan-sen line (conversion line)
- Kijun-sen line (base line)
- Senkou Span A line
- Senkou Span B line
- Chikou Span line, also known as the lagging line
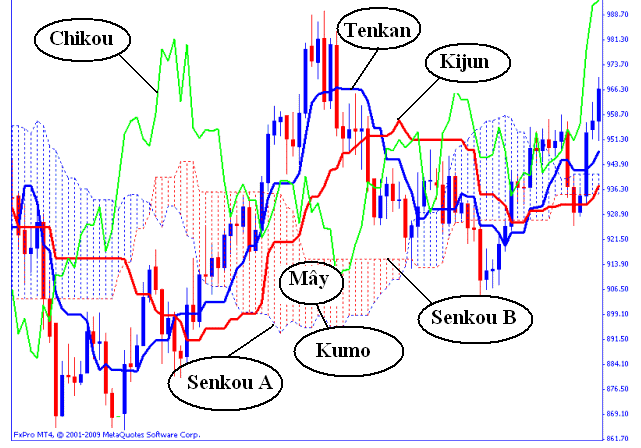
Ichimoku indicator
How to use Ichimoku Cloud
If the price trades above the Kumo cloud, the market is trending up and vice versa, if the price is trading below the Kumo cloud, the market is trending down.
If the price is in the Kumo cloud, the market has an unclear trend.
The thicker the cloud, the stronger the market momentum, and when the cloud is thin, it indicates that the market has weak momentum.
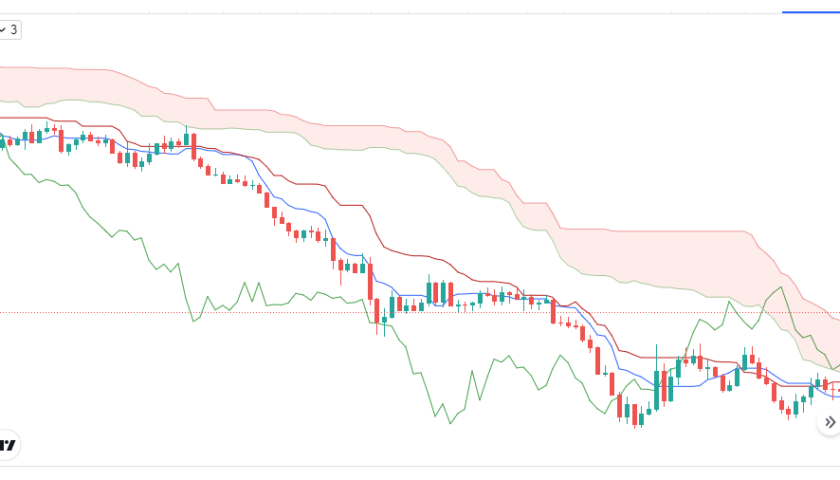
How to use Ichimoku indicator
7. ADX Indicator (Average Directional Index)
ADX or Average Directional Index is an oscillating indicator used to determine the strength of the trend in the market. Traders often use this indicator to determine whether the market is sideways or has started a trend.
ADX usually fluctuates between 0 – 100, if the ADX values are larger, the market trend is stronger. If ADX is down to 20, the current trend is weak.
How to use the ADX indicator
The ADX indicator helps investors determine the strength of the market trend. Thereby, investors will make decisions to trade or close orders.
Based on the ADX indicator value, we have the following trends:
- 0 – 25: weak trend (sideways market)
- 25 – 50: strong trend
- 50 – 75: very strong uptrend
- 75 – 100: the trend is extremely strong
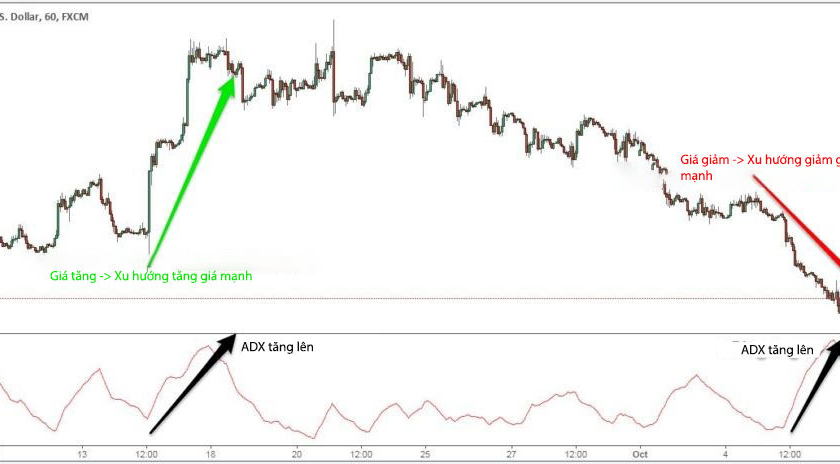
How to use ADX indicator
8. Zig Zag Indicator
The Zig Zag indicator is a technical indicator used to measure top and bottom price levels in the market.
The principle of using the Zig Zag indicator is relatively simple, it will filter out noise signals from price action by removing unimportant information, this helps traders see the market with a simpler and more accurate perspective.
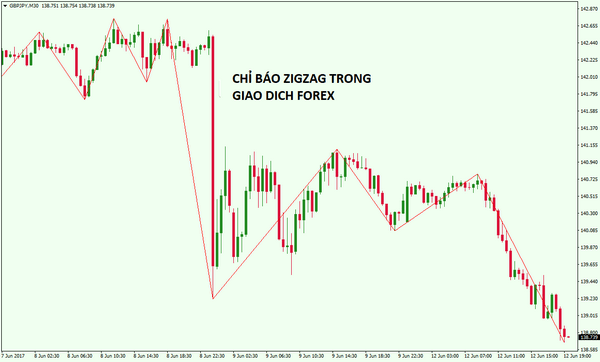
ZigZag indicator
How to use the Zig Zag indicator
- Combine with Elliott wave theory
The biggest challenge of Elliott waves is determining where the waves begin and end. At this point, the Zig Zag indicator can completely help you with that.
The Zig Zag indicator is often used with Elliott Wave theory to determine the position of each wave in the overall cycle.
- Combine with Fibonacci retracement
Adding the Zig Zag indicator shows the positions where rallies and declines have occurred as well as where they started and ended.
The Zig Zag indicator eliminates insignificant small fluctuations and noise in the market, so it will greatly assist in finding important pivot points.
Tuy nhiên, chỉ báo Zig Zag có thể repaint, do đó không nên sử dụng nó để đưa ra các quyết định giao dịch ngay lập tức. Thay vào đó, hãy xem xét nó như một công cụ để xác định các mức giá quan trọng và sử dụng nó như một phần của phân tích tổng thể của bạn.
Trên đây là Top các chỉ báo MT4 và MT5 hữu ích nhất khi trading forex, các trader nên sử dụng kết hợp các chỉ báo trên và áp dụng thêm những phương pháp phân tích kỹ thuật khác để đạt hiệu quả cao nhất nhé.
Ngoài ra, bạn có thể tham khảo thêm các công cụ hỗ trợ giao dịch forex khác tại: https://autoinvestorpro.com/category/mt4-mt5-tools/


